
Change LocationEn
Choose Your Location

[1] Viatris is not providing forward-looking guidance for U.S. GAAP net earnings (loss) or a quantitative reconciliation of its 2022 adjusted EBITDA guidance. U.S. GAAP net cash provided by operating activities for 2022 is estimated to be between $3.1 billion and $3.3 billion. Please see "2022 Financial Guidance" and "Non-GAAP Financial Measures" for additional information.
PITTSBURGH, Aug. 8, 2022 /PRNewswire/ -- Viatris Inc. (NASDAQ: VTRS) today reported strong results for the second quarter of 2022 and provided an update to its full year 2022 financial guidance.

[2] Please see footnote [1] above as well as "2022 Financial Guidance" and "Non-GAAP Financial Measures" for additional information.
Viatris also announced that its Board of Directors declared a quarterly dividend of twelve cents ($0.12) for each issued and outstanding share of the company's common stock. The dividend is payable on Sept. 16, 2022, to shareholders of record at the close of business on Aug. 24, 2022.
Viatris CEO Michael Goettler said: "We are hitting on all cylinders operationally, even while foreign exchange rates continue to be challenging, and have now demonstrated six consecutive quarters of strong performance. We continue to deliver on our financial and strategic commitments and are making good progress on all the reshaping initiatives announced in February, including the further ramp up of our inorganic activity in our Global Healthcare Gateway."
Viatris President Rajiv Malik said: "We believe our strong and consistent operational execution reflects the resilience of a diversified business that has been built deliberately to ensure we are not dependent on any one market or product and allows us to remain agile and opportunistic to perform consistently across all geographies. Looking ahead, we are very excited to build upon our strong legacy in development and leverage our extensive scientific capabilities to continue moving up the value chain. Through our Global Healthcare Gateway, we expect to further strengthen our deep pipeline to develop more 505(b)(2)s and new chemical entities in the previously disclosed therapeutic areas, while maintaining our therapeutically agnostic portfolio."
Viatris CFO Sanjeev Narula said: "We are proud of our solid operational results which exceeded our expectations and included generating approximately $1.8 billion in free cash flow in the first half of 2022. We also retired $1.5 billion in debt during the same period, which puts us well on track to meet our 2022 debt paydown commitment. As we look ahead to the rest of 2022, we remain confident in the operational strength of the business. Therefore, we are reaffirming our adjusted EBITDA and free cash flow guidance ranges despite foreign exchange headwinds. We believe that our capital allocation framework, including the commitment to the dividend and maintaining the investment grade rating, will continue to be a force in creating long term value."
Financial Summary
|
Three Months Ended |
|||||||
|
June 30, |
|||||||
|
(Unaudited; in millions, except per share amounts and %s) |
2022 |
2021 |
Reported Change |
Operational Change(1) |
|||
|
Total Net Sales |
$ 4,105.4 |
$ 4,561.7 |
(10) % |
(3) % |
|||
|
Developed Markets |
2,479.1 |
2,640.4 |
(6) % |
1 % |
|||
|
Emerging Markets |
650.9 |
870.0 |
(25) % |
(19) % |
|||
|
JANZ |
427.1 |
501.0 |
(15) % |
(2) % |
|||
|
Greater China |
548.3 |
550.3 |
— % |
1 % |
|||
|
Net Sales by Product Category |
|||||||
|
Brands |
$ 2,483.1 |
$ 2,701.7 |
(8) % |
(1) % |
|||
|
Complex Gx and Biosimilars |
354.8 |
332.8 |
7 % |
11 % |
|||
|
Generics |
1,267.5 |
1,527.2 |
(17) % |
(11) % |
|||
|
U.S. GAAP Gross Profit |
$ 1,703.3 |
$ 1,327.7 |
28 % |
||||
|
U.S. GAAP Gross Margin |
41.4 % |
29.0 % |
|||||
|
Adjusted Gross Profit (2) |
$ 2,411.7 |
$ 2,677.2 |
(10) % |
||||
|
Adjusted Gross Margin (2) |
58.6 % |
58.5 % |
|||||
|
U.S. GAAP Net Earnings (Loss) |
$ 313.9 |
$ (279.2) |
nm |
||||
|
Adjusted Net Earnings (2) |
$ 1,065.3 |
$ 1,180.6 |
(10) % |
||||
|
EBITDA (2) |
$ 1,257.6 |
$ 1,281.8 |
(2) % |
||||
|
Adjusted EBITDA (2) |
$ 1,482.1 |
$ 1,675.4 |
(12) % |
(6) % |
|||
|
U.S. GAAP net cash provided by operating activities |
$ 802.5 |
$ 559.4 |
43 % |
||||
|
Capital expenditures |
83.9 |
89.3 |
(6) % |
||||
|
Free cash flow (2) |
$ 718.6 |
$ 470.1 |
53 % |
||||
|
Six Months Ended |
|||||||
|
June 30, |
|||||||
|
(Unaudited; in millions, except per share amounts and %s) |
2022 |
2021 |
Reported Change |
Operational Change(1) |
|||
|
Total Net Sales |
$ 8,283.6 |
$ 8,961.8 |
(8) % |
(2) % |
|||
|
Developed Markets |
4,955.2 |
5,212.0 |
(5) % |
— % |
|||
|
Emerging Markets |
1,356.1 |
1,624.7 |
(17) % |
(10) % |
|||
|
JANZ |
850.9 |
982.9 |
(13) % |
(3) % |
|||
|
Greater China |
1,121.4 |
1,142.2 |
(2) % |
(2) % |
|||
|
Net Sales by Product Category |
|||||||
|
Brands |
$ 5,037.2 |
$ 5,426.3 |
(7) % |
(1) % |
|||
|
Complex Gx and Biosimilars |
745.6 |
661.7 |
13 % |
16 % |
|||
|
Generics |
2,500.8 |
2,873.8 |
(13) % |
(8) % |
|||
|
U.S. GAAP Gross Profit |
$ 3,474.5 |
$ 2,455.0 |
42 % |
||||
|
U.S. GAAP Gross Margin |
41.8 % |
27.3 % |
|||||
|
Adjusted Gross Profit (2) |
$ 4,905.1 |
$ 5,317.1 |
(8) % |
||||
|
Adjusted Gross Margin (2) |
59.0 % |
59.0 % |
|||||
|
U.S. GAAP Net Earnings (Loss) |
$ 713.1 |
$ (1,316.8) |
nm |
||||
|
Adjusted Net Earnings (2) |
$ 2,190.6 |
$ 2,297.0 |
(5) % |
||||
|
EBITDA (2) |
$ 2,667.2 |
$ 2,449.9 |
9 % |
||||
|
Adjusted EBITDA (2) |
$ 3,068.4 |
$ 3,312.0 |
(7) % |
(3) % |
|||
|
U.S. GAAP net cash provided by operating activities |
$ 1,941.0 |
$ 1,408.2 |
38 % |
||||
|
Capital expenditures |
148.4 |
138.8 |
7 % |
||||
|
Free cash flow (2) |
$ 1,792.6 |
$ 1,269.4 |
41 % |
||||
|
___________ |
|
|
(1) |
Represents operational change for net sales and adjusted EBITDA which excludes the impacts of foreign currency translation. See "Certain Key Terms" in this release for more information. |
|
(2) |
Non-GAAP financial measures. See "Non-GAAP Financial Measures" for additional information. |
Second Quarter Highlights
2022 Financial Guidance
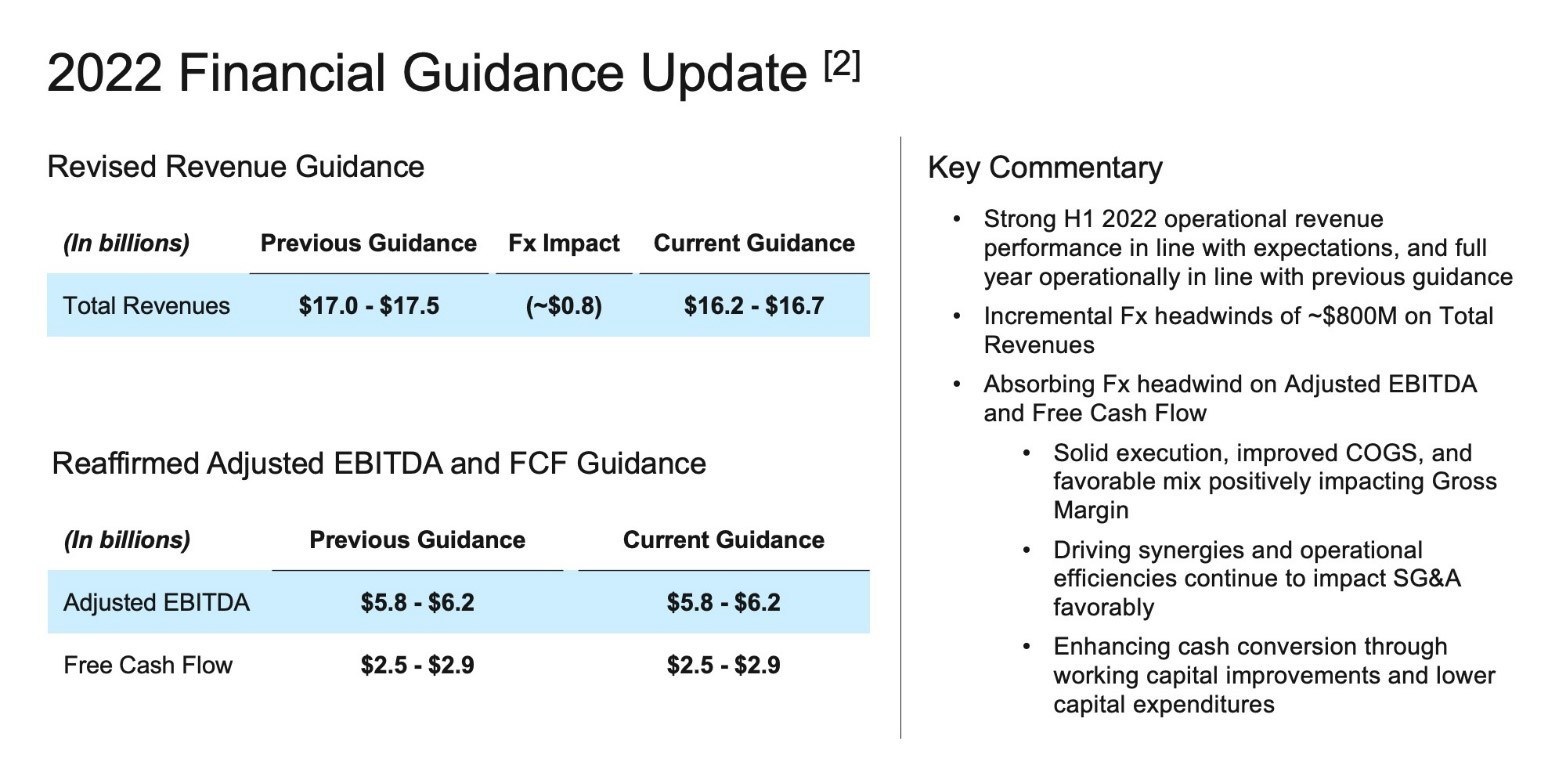
The U.S. dollar has continued to strengthen across major currencies that impact the Company's condensed consolidated financial statements. To reflect the Company's currently expected negative impact of foreign exchange rates of approximately $800 million, the Company is revising its 2022 guidance range for total revenues as set forth above. The Company is reaffirming its 2022 guidance ranges for adjusted EBITDA and free cash flow as it currently believes that it can absorb the foreign exchange rate impacts within those ranges. The Company is not providing forward-looking guidance for U.S. GAAP net earnings or a quantitative reconciliation of its 2022 adjusted EBITDA guidance to the most directly comparable U.S. GAAP measure, U.S. GAAP net earnings (loss), because it is unable to predict with reasonable certainty the ultimate outcome of certain significant items, including integration and acquisition-related expenses, restructuring expenses, asset impairments, litigation settlements and other contingencies, such as changes to contingent consideration and certain other gains or losses, as well as related income tax accounting, because certain of these items have not occurred, are out of the Company's control and/or cannot be reasonably predicted without unreasonable effort. These items are uncertain, depend on various factors, and could have a material impact on U.S. GAAP reported results for the guidance period.
Conference Call and Earnings Materials
Viatris Inc. will host a conference call and live webcast, today at 8:30 a.m. ET, to review the Company's financial results for the second quarter ended June 30, 2022. Investors and the general public are invited to listen to a live webcast of the call at investor.viatris.com or by calling 866.342.8591 or 203.518.9713 for international callers (ID#: VTRSQ222). The "Viatris Q2 Earnings Presentation", which will be referenced during the call, can be found at investor.viatris.com. A replay of the webcast also will be available on the website.
Certain Key Terms
New product sales, new product launches or new product revenues refer to revenue from new products launched in 2022 and the carryover impact of new products, including business development, launched within the last twelve months.
Operational change refers to constant currency percentage change and is derived by translating amounts for the current period at prior year comparative period exchange rates, and in doing so shows the percentage change from 2022 constant currency net sales, revenues and adjusted EBITDA to the corresponding amount in the prior year.
Non-GAAP Financial Measures
This press release includes the presentation and discussion of certain financial information that differs from what is reported under accounting principles generally accepted in the United States ("U.S. GAAP"). These non-GAAP financial measures, including, but not limited to, adjusted gross profit, adjusted gross margins, adjusted net earnings, EBITDA, adjusted EBITDA, free cash flow, adjusted R&D and as a % of total revenues, adjusted SG&A and as a % of total revenues, adjusted earnings from operations, adjusted interest expense, adjusted other expense (income), net, adjusted effective tax rate, constant currency total revenues, constant currency net sales and constant currency adjusted EBITDA are presented in order to supplement investors' and other readers' understanding and assessment of the financial performance of Viatris Inc. ("Viatris" or the "Company"). Free cash flow refers to U.S. GAAP net cash provided by operating activities, less capital expenditures. Adjusted EBITDA margin refers to adjusted EBITDA divided by total revenues. Management uses these measures internally for forecasting, budgeting, measuring its operating performance, and incentive-based awards. Primarily due to acquisitions and other significant events which may impact comparability of our periodic operating results, Viatris believes that an evaluation of its ongoing operations (and comparisons of its current operations with historical and future operations) would be difficult if the disclosure of its financial results was limited to financial measures prepared only in accordance with U.S. GAAP. We believe that non-GAAP financial measures are useful supplemental information for our investors and when considered together with our U.S. GAAP financial measures and the reconciliation to the most directly comparable U.S. GAAP financial measure, provide a more complete understanding of the factors and trends affecting our operations. The financial performance of the Company is measured by senior management, in part, using adjusted metrics included herein, along with other performance metrics. In addition, the Company believes that including EBITDA and supplemental adjustments applied in presenting adjusted EBITDA is appropriate to provide additional information to investors to demonstrate the Company's ability to comply with financial debt covenants and assess the Company's ability to incur additional indebtedness. The Company also believes that adjusted EBITDA better focuses management on the Company's underlying operational results and true business performance and, is used, in part, for management's incentive compensation. We also report sales performance using the non-GAAP financial measures of "constant currency", also referred to herein as "operational change", total revenues, net sales and adjusted EBITDA. These measures provide information on the change in total revenues, net sales and adjusted EBITDA assuming that foreign currency exchange rates had not changed between the prior and current period. The comparisons presented at constant currency rates reflect comparative local currency sales at the prior year's foreign exchange rates. We routinely evaluate our net sales, total revenues and adjusted EBITDA performance at constant currency so that sales results can be viewed without the impact of foreign currency exchange rates, thereby facilitating a period-to-period comparison of our operational activities and believe that this presentation also provides useful information to investors for the same reason. The "Summary of Total Revenues by Segment" table below compares net sales on an actual and constant currency basis for each reportable segment for the quarters and six months ended June 30, 2022 and 2021 as well as for total revenues. Also, set forth below, Viatris has provided reconciliations of such non-GAAP financial measures to the most directly comparable U.S. GAAP financial measures. Investors and other readers are encouraged to review the related U.S. GAAP financial measures and the reconciliations of the non-GAAP measures to their most directly comparable U.S. GAAP measures set forth below, and investors and other readers should consider non-GAAP measures only as supplements to, not as substitutes for or as superior measures to, the measures of financial performance prepared in accordance with U.S. GAAP. For additional information regarding the components and uses of Non-GAAP financial measures refer to Management's Discussion and Analysis of Financial Condition and Results of Operations—Use of Non-GAAP Financial Measures section of Viatris' Quarterly Report on Form 10-Q for the three months ended June 30, 2022.
About Viatris
Viatris Inc. (NASDAQ: VTRS) is a global pharmaceutical company empowering people worldwide to live healthier at every stage of life. We provide access to medicines, advance sustainable operations, develop innovative solutions and leverage our collective expertise to connect more people to more products and services through our one-of-a-kind Global Healthcare Gateway®. Formed in November 2020, Viatris brings together scientific, manufacturing and distribution expertise with proven regulatory, medical, and commercial capabilities to deliver high-quality medicines to patients in more than 165 countries and territories. Viatris' portfolio comprises more than 1,400 approved molecules across a wide range of therapeutic areas, spanning both non-communicable and infectious diseases, including globally recognized brands, complex generic and branded medicines, a portfolio of biosimilars and a variety of over-the-counter consumer products. With approximately 37,000 colleagues globally, Viatris is headquartered in the U.S., with global centers in Pittsburgh, Shanghai and Hyderabad, India. Learn more at viatris.com and investor.viatris.com, and connect with us on Twitter at @ViatrisInc, LinkedIn and YouTube.
Forward-looking Statements
This release contains "forward-looking statements". These statements are made pursuant to the safe harbor provisions of the Private Securities Litigation Reform Act of 1995. Such forward-looking statements may include, without limitation, statements about Viatris' 2022 financial guidance; that Viatris reaffirms adjusted EBITDA and free cash flow guidance ranges despite foreign exchange headwinds; revises total revenues guidance range solely to reflect the incremental impact of foreign exchange; Biocon Biologics Transaction on track for close in second half of 2022; strong H1 2022 operational performance in line with expectations, and full year operationally in line with previous guidance; absorbing Fx headwind on adjusted EBITDA and free cash flow; solid execution, improved COGS, and favorable mix positively impacting gross margins; driving synergies and operational efficiencies continue to impact SG&A favorably; enhancing cash conversion through working capital improvements and lower capital expenditures; Viatris' Board of Directors declared a quarterly dividend of twelve cents ($0.12) for each issued and outstanding share of the company's common stock; the dividend is payable on Sept. 16, 2022, to shareholders of record at the close of business on Aug. 24, 2022; we are hitting on all cylinders operationally, even while foreign exchange rates continue to be challenging, and have now demonstrated six consecutive quarters of strong performance; we continue to deliver on our financial and strategic commitments and are making good progress on all the reshaping initiatives announced in February, including the further ramp up of our inorganic activity in our Global Healthcare Gateway; we believe our strong and consistent operational execution reflects the resilience of a diversified business that has been built deliberately to ensure we are not dependent on any one market or product and allows us to remain agile and opportunistic to perform consistently across all geographies; looking ahead, we are very excited to build upon our strong legacy in development and leverage our extensive scientific capabilities to continue moving up the value chain; through our Global Healthcare Gateway, we expect to further strengthen our deep pipeline to develop more 505(b)(2)s and new chemical entities in the previously disclosed therapeutic areas, while maintaining our therapeutically agnostic portfolio; we are proud of our solid operational results which exceeded our expectations and included generating approximately $1.8 billion in free cash flow in the first half of 2022; we also retired $1.5 billion in debt during the same period, which puts us well on track to meet our 2022 debt paydown commitment; as we look ahead to the rest of 2022, we remain confident in the operational strength of the business; we are reaffirming our adjusted EBITDA and free cash flow guidance ranges despite foreign exchange headwinds; we believe that our capital allocation framework, including the commitment to the dividend and maintaining the investment grade rating, will continue to be a force in creating long term value; the company is on track to achieve approximately $600 million in new product revenues in 2022; the Company paid down approximately $627 million in debt in the second quarter (approximately $1.5 billion for the first half of the year) and continues to target approximately $2 billion in debt repayment in 2022; the Company remains committed to maintaining its investment grade credit rating; statements about the pending transaction between Viatris and Biocon Biologics Limited ("Biocon Biologics") pursuant to which Viatris will contribute its biosimilars portfolio to Biocon Biologics (the "Biocon Biologics Transaction"), statements about the transaction pursuant to which Mylan N.V. ("Mylan") combined with Pfizer Inc.'s Upjohn business (the "Upjohn Business") in a Reverse Morris Trust transaction (the "Combination") and Upjohn Inc. became the parent entity of the combined Upjohn Business and Mylan business and was renamed "Viatris Inc.", the benefits and synergies of the Combination or our global restructuring program, future opportunities for the Company and its products and any other statements regarding the Company's future operations, financial or operating results, capital allocation, dividend policy and payments, debt ratio and covenants, anticipated business levels, future earnings, planned activities, anticipated growth, market opportunities, strategies, competitions, commitments, confidence in future results, efforts to create, enhance or otherwise unlock the value of our unique global platform, and other expectations and targets for future periods. Forward-looking statements may often be identified by the use of words such as "will", "may", "could", "should", "would", "project", "believe", "anticipate", "expect", "plan", "estimate", "forecast", "potential", "pipeline", "intend", "continue", "target", "seek" and variations of these words or comparable words. Because forward-looking statements inherently involve risks and uncertainties, actual future results may differ materially from those expressed or implied by such forward-looking statements. Factors that could cause or contribute to such differences include, but are not limited to: the possibility that the Company may be unable to achieve expected benefits, synergies and operating efficiencies in connection with the Combination or its global restructuring program within the expected timeframe or at all; the pending Biocon Biologics Transaction and other strategic initiatives, including potential divestitures, may not achieve their intended benefits; operational or financial difficulties or losses associated with the Company's reliance on agreements with Pfizer in connection with the Combination, including with respect to transition services; the potential impact of public health outbreaks, epidemics and pandemics, including the ongoing challenges and uncertainties posed by the COVID-19 pandemic; the Company's failure to achieve expected or targeted future financial and operating performance and results; actions and decisions of healthcare and pharmaceutical regulators; changes in relevant laws and regulations, including but not limited to changes in tax, healthcare and pharmaceutical laws and regulations globally (including the impact of potential tax reform in the U.S.); the ability to attract and retain key personnel; the Company's liquidity, capital resources and ability to obtain financing; any regulatory, legal or other impediments to the Company's ability to bring new products to market, including but not limited to "at-risk launches"; success of clinical trials and the Company's or its partners' ability to execute on new product opportunities and develop, manufacture and commercialize products; any changes in or difficulties with the Company's manufacturing facilities, including with respect to inspections, remediation and restructuring activities, supply chain or inventory or the ability to meet anticipated demand; the scope, timing and outcome of any ongoing legal proceedings, including government inquiries or investigations, and the impact of any such proceedings on the Company; any significant breach of data security or data privacy or disruptions to our information technology systems; risks associated with having significant operations globally; the ability to protect intellectual property and preserve intellectual property rights; changes in third-party relationships; the effect of any changes in the Company's or its partners' customer and supplier relationships and customer purchasing patterns, including customer loss and business disruption being greater than expected following the Combination; the impacts of competition, including decreases in sales or revenues as a result of the loss of market exclusivity for certain products; changes in the economic and financial conditions of the Company or its partners; uncertainties regarding future demand, pricing and reimbursement for the Company's products; uncertainties and matters beyond the control of management, including but not limited to general political and economic conditions, inflation rates and global exchange rates; and inherent uncertainties involved in the estimates and judgments used in the preparation of financial statements, and the providing of estimates of financial measures, in accordance with U.S. GAAP and related standards or on an adjusted basis. For more detailed information on the risks and uncertainties associated with Viatris, see the risks described in Part I, Item 1A in the Company's Annual Report on Form 10-K for the year ended December 31, 2021, as amended, and our other filings with the SEC. You can access Viatris' filings with the SEC through the SEC website at www.sec.gov or through our website, and Viatris strongly encourages you to do so. Viatris routinely posts information that may be important to investors on our website at investor.viatris.com, and we use this website address as a means of disclosing material information to the public in a broad, non-exclusionary manner for purposes of the SEC's Regulation Fair Disclosure (Reg FD). The contents of our website are not incorporated into this release or our other filings with the SEC. Viatris undertakes no obligation to update any statements herein for revisions or changes after the date of this release other than as required by law.
|
Viatris Inc. and Subsidiaries |
|||||||
|
Three Months Ended |
Six Months Ended |
||||||
|
June 30, |
June 30, |
||||||
|
2022 |
2021 |
2022 |
2021 |
||||
|
Revenues: |
|||||||
|
Net sales |
$ 4,105.4 |
$ 4,561.7 |
$ 8,283.6 |
$ 8,961.8 |
|||
|
Other revenues |
11.4 |
16.1 |
24.9 |
46.3 |
|||
|
Total revenues |
4,116.8 |
4,577.8 |
8,308.5 |
9,008.1 |
|||
|
Cost of sales |
2,413.5 |
3,250.1 |
4,834.0 |
6,553.1 |
|||
|
Gross profit |
1,703.3 |
1,327.7 |
3,474.5 |
2,455.0 |
|||
|
Operating expenses: |
|||||||
|
Research and development |
162.6 |
147.7 |
304.9 |
331.8 |
|||
|
Selling, general and administrative |
981.1 |
1,204.8 |
1,896.4 |
2,391.3 |
|||
|
Litigation settlements and other contingencies, net |
10.9 |
23.0 |
17.1 |
45.9 |
|||
|
Total operating expenses |
1,154.6 |
1,375.5 |
2,218.4 |
2,769.0 |
|||
|
Earnings (loss) from operations |
548.7 |
(47.8) |
1,256.1 |
(314.0) |
|||
|
Interest expense |
145.9 |
167.1 |
292.1 |
336.1 |
|||
|
Other expense, net |
13.5 |
4.2 |
47.2 |
10.3 |
|||
|
Earnings (loss) before income taxes |
389.3 |
(219.1) |
916.8 |
(660.4) |
|||
|
Income tax provision |
75.4 |
60.1 |
203.7 |
656.4 |
|||
|
Net earnings (loss) |
313.9 |
(279.2) |
$ 713.1 |
$ (1,316.8) |
|||
|
Earnings (loss) per share attributable to Viatris Inc. shareholders |
|||||||
|
Basic |
$ 0.26 |
$ (0.23) |
$ 0.59 |
$ (1.09) |
|||
|
Diluted |
$ 0.26 |
$ (0.23) |
$ 0.59 |
$ (1.09) |
|||
|
Weighted average shares outstanding: |
|||||||
|
Basic |
1,212.3 |
1,208.8 |
1,211.4 |
1,208.2 |
|||
|
Diluted |
1,217.1 |
1,208.8 |
1,215.1 |
1,208.2 |
|||
|
Viatris Inc. and Subsidiaries |
|||
|
June 30, |
December 31, |
||
|
ASSETS |
|||
|
Assets |
|||
|
Current assets: |
|||
|
Cash and cash equivalents |
$ 664.7 |
$ 701.2 |
|
|
Accounts receivable, net |
3,736.2 |
4,266.4 |
|
|
Inventories |
3,612.5 |
3,977.7 |
|
|
Prepaid expenses and other current assets |
1,697.7 |
1,957.6 |
|
|
Assets held for sale |
1,465.4 |
— |
|
|
Total current assets |
11,176.5 |
10,902.9 |
|
|
Intangible assets, net |
24,101.1 |
26,134.2 |
|
|
Goodwill |
10,523.0 |
12,113.7 |
|
|
Other non-current assets |
5,324.5 |
5,692.0 |
|
|
Total assets |
$ 51,125.1 |
$ 54,842.8 |
|
|
LIABILITIES AND EQUITY |
|||
|
Liabilities |
|||
|
Current portion of long-term debt and other long-term obligations |
$ 768.2 |
$ 1,877.5 |
|
|
Liabilities held for sale |
285.1 |
— |
|
|
Other current liabilities |
6,627.9 |
8,006.9 |
|
|
Long-term debt |
19,206.4 |
19,717.1 |
|
|
Other non-current liabilities |
4,432.1 |
4,748.6 |
|
|
Total liabilities |
31,319.7 |
34,350.1 |
|
|
Shareholders' equity |
19,805.4 |
20,492.7 |
|
|
Total liabilities and equity |
$ 51,125.1 |
$ 54,842.8 |
|
|
Viatris Inc. and Subsidiaries |
||||
|
Key Product Net Sales, on a Consolidated Basis |
||||
|
(Unaudited) |
||||
|
Three months ended June 30, |
Six months ended June 30, |
|||
|
(In millions) |
2022 |
2021 |
2022 |
2021 |
|
Select Key Global Products |
||||
|
Lipitor ® |
$ 405.6 |
$ 398.3 |
$ 845.7 |
$ 862.9 |
|
Norvasc ® |
203.0 |
209.8 |
410.8 |
437.5 |
|
Lyrica ® |
155.8 |
192.5 |
327.4 |
380.3 |
|
Viagra ® |
115.1 |
134.8 |
244.9 |
274.4 |
|
EpiPen® Auto-Injectors |
106.5 |
104.1 |
195.3 |
207.8 |
|
Celebrex ® |
85.9 |
82.3 |
171.2 |
171.3 |
|
Creon ® |
75.4 |
80.7 |
150.1 |
150.6 |
|
Effexor ® |
73.7 |
83.5 |
151.2 |
160.1 |
|
Zoloft ® |
62.5 |
70.9 |
135.6 |
147.5 |
|
Xalabrands |
42.7 |
58.3 |
95.7 |
116.2 |
|
Select Key Segment Products |
||||
|
Dymista ® |
$ 55.5 |
$ 54.6 |
$ 99.4 |
$ 94.9 |
|
Yupelri ® |
49.1 |
41.8 |
92.7 |
78.7 |
|
Amitiza ® |
44.1 |
52.1 |
85.9 |
98.0 |
|
Xanax ® |
37.2 |
48.8 |
77.2 |
93.9 |
|
____________ |
|
|
(a) |
The Company does not disclose net sales for any products considered competitively sensitive. |
|
(b) |
Products disclosed may change in future periods, including as a result of seasonality, competition or new product launches. |
|
(c) |
Amounts for the three and six months ended June 30, 2022 include the unfavorable impact of foreign currency translations compared to the prior year period. |
|
Viatris Inc. and Subsidiaries |
|||||||
|
Reconciliation of U.S. GAAP Net Earnings (Loss) to Adjusted Net Earnings |
|||||||
|
Below is a reconciliation of U.S. GAAP net earnings (loss) to adjusted net earnings for the three and six months ended June 30, 2022 compared to the prior year period: |
|||||||
|
Three Months Ended June 30, |
Six Months Ended June 30, |
||||||
|
(In millions) |
2022 |
2021 |
2022 |
2021 |
|||
|
U.S. GAAP net earnings (loss) |
$ 313.9 |
$ (279.2) |
$ 713.1 |
$ (1,316.8) |
|||
|
Purchase accounting related amortization (primarily included in cost of sales) |
644.9 |
1,169.8 |
1,303.8 |
2,424.8 |
|||
|
Litigation settlements and other contingencies, net |
10.9 |
23.0 |
17.1 |
45.9 |
|||
|
Interest expense (primarily amortization of premiums and discounts on long term debt) |
(13.1) |
(13.4) |
(26.8) |
(26.7) |
|||
|
Clean energy investments pre-tax loss |
0.1 |
16.7 |
— |
34.6 |
|||
|
Acquisition related costs (primarily included in SG&A) (a) |
122.4 |
48.4 |
207.1 |
108.2 |
|||
|
Restructuring related costs (b) |
10.2 |
254.7 |
27.0 |
570.1 |
|||
|
Share-based compensation expense |
29.4 |
31.0 |
57.7 |
63.7 |
|||
|
Other special items included in: |
|||||||
|
Cost of sales (c) |
40.5 |
99.4 |
81.5 |
186.1 |
|||
|
Research and development expense |
0.6 |
(6.3) |
0.9 |
8.4 |
|||
|
Selling, general and administrative expense |
17.0 |
10.2 |
24.4 |
29.5 |
|||
|
Other expense, net |
(0.4) |
— |
(1.9) |
— |
|||
|
Tax effect of the above items and other income tax related items (d) |
(111.1) |
(173.7) |
(213.3) |
169.2 |
|||
|
Adjusted net earnings |
$ 1,065.3 |
$ 1,180.6 |
$ 2,190.6 |
$ 2,297.0 |
|||
|
____________ |
|
|
Significant items include the following: |
|
|
(a) |
Acquisition related costs consist primarily of transaction costs including legal and consulting fees and integration activities. |
|
(b) |
For the three and six months ended June 30, 2022, charges include approximately $6.7 million and $19.8 million, respectively, in cost of sales and approximately $3.5 million and $7.2 million, respectively, in SG&A. |
|
(c) |
For the three and six months ended June 30, 2022, charges include incremental manufacturing variances at plants in the 2020 restructuring program of approximately $16.5 million and $47.8 million, respectively. |
|
(d) |
Adjusted for changes for uncertain tax positions and for certain impacts of the Combination. |
|
Reconciliation of U.S. GAAP Net Earnings (Loss) to EBITDA and Adjusted EBITDA |
|||||||
|
Below is a reconciliation of U.S. GAAP net earnings (loss) to EBITDA and adjusted EBITDA for the three and six months ended June 30, 2022 compared to the prior year period: |
|||||||
|
Three Months Ended |
Six Months Ended |
||||||
|
June 30, |
June 30, |
||||||
|
(In millions) |
2022 |
2021 |
2022 |
2021 |
|||
|
U.S. GAAP net earnings (loss) |
$ 313.9 |
$ (279.2) |
$ 713.1 |
$ (1,316.8) |
|||
|
Add adjustments: |
|||||||
|
Net contribution attributable to equity method investments |
0.1 |
16.7 |
— |
34.6 |
|||
|
Income tax provision |
75.4 |
60.1 |
203.7 |
656.4 |
|||
|
Interest expense (a) |
145.9 |
167.1 |
292.1 |
336.1 |
|||
|
Depreciation and amortization (b) |
722.3 |
1,317.1 |
1,458.3 |
2,739.6 |
|||
|
EBITDA |
$ 1,257.6 |
$ 1,281.8 |
$ 2,667.2 |
$ 2,449.9 |
|||
|
Add adjustments: |
|||||||
|
Share-based compensation expense |
29.4 |
31.0 |
57.7 |
63.7 |
|||
|
Litigation settlements and other contingencies, net |
10.9 |
23.0 |
17.1 |
45.9 |
|||
|
Restructuring, acquisition related and other special items (c) |
184.2 |
339.6 |
326.4 |
752.5 |
|||
|
Adjusted EBITDA |
$ 1,482.1 |
$ 1,675.4 |
$ 3,068.4 |
$ 3,312.0 |
|||
|
____________ |
|
|
(a) |
Includes amortization of premiums and discounts on long-term debt. |
|
(b) |
Includes purchase accounting related amortization. |
|
(c) |
See items detailed in the Reconciliation of U.S. GAAP Net Earnings (Loss) to Adjusted Net Earnings. |
|
Summary of Total Revenues by Segment |
|||||||||||
|
Three Months Ended |
|||||||||||
|
June 30, |
|||||||||||
|
(In millions, except %s) |
2022 |
2021 |
% Change |
2022 Currency Impact (1) |
2022 Constant Currency Revenues |
Constant Currency % Change (2) |
|||||
|
Net sales |
|||||||||||
|
Developed Markets |
$ 2,479.1 |
$ 2,640.4 |
(6) % |
$ 181.4 |
$ 2,660.5 |
1 % |
|||||
|
Greater China |
548.3 |
550.3 |
— % |
5.4 |
553.7 |
1 % |
|||||
|
JANZ |
427.1 |
501.0 |
(15) % |
64.9 |
491.9 |
(2) % |
|||||
|
Emerging Markets |
650.9 |
870.0 |
(25) % |
54.0 |
705.0 |
(19) % |
|||||
|
Total net sales |
4,105.4 |
4,561.7 |
(10) % |
305.7 |
4,411.1 |
(3) % |
|||||
|
Other revenues (3) |
11.4 |
16.1 |
(29) % |
0.8 |
12.2 |
(24) % |
|||||
|
Consolidated total revenues (4) |
$ 4,116.8 |
$ 4,577.8 |
(10) % |
$ 306.5 |
$ 4,423.3 |
(3) % |
|||||
|
Six Months Ended |
|||||||||||
|
June 30, |
|||||||||||
|
(In millions, except %s) |
2022 |
2021 |
% Change |
2022 Currency Impact (1) |
2022 Constant Currency Revenues |
Constant Currency % Change (2) |
|||||
|
Net sales |
|||||||||||
|
Developed Markets |
$ 4,955.2 |
$ 5,212.0 |
(5) % |
$ 270.5 |
$ 5,225.8 |
— % |
|||||
|
Greater China |
1,121.4 |
1,142.2 |
(2) % |
(2.7) |
1,118.7 |
(2) % |
|||||
|
JANZ |
850.9 |
982.9 |
(13) % |
102.7 |
953.5 |
(3) % |
|||||
|
Emerging Markets |
1,356.1 |
1,624.7 |
(17) % |
105.5 |
1,461.6 |
(10) % |
|||||
|
Total net sales |
$ 8,283.6 |
$ 8,961.8 |
(8) % |
$ 476.0 |
$ 8,759.6 |
(2) % |
|||||
|
Other revenues (3) |
24.9 |
46.3 |
(46) % |
1.3 |
26.2 |
(43) % |
|||||
|
Consolidated total revenues (4) |
$ 8,308.5 |
$ 9,008.1 |
(8) % |
$ 477.3 |
$ 8,785.8 |
(2) % |
|||||
|
____________ |
|
|
(1) |
Currency impact is shown as unfavorable (favorable). |
|
(2) |
The constant currency percentage change is derived by translating net sales or revenues for the current period at prior year comparative period exchange rates, and in doing so shows the percentage change from 2022 constant currency net sales or revenues to the corresponding amount in the prior year. |
|
(3) |
For the three months ended June 30, 2022, other revenues in Developed Markets and Emerging Markets were approximately $4.8 million and $6.6 million, respectively. For the six months ended June 30, 2022, other revenues in Developed Markets, JANZ, and Emerging Markets were approximately $11.1 million, $0.9 million, and $12.9 million, respectively. |
|
(4) |
Amounts exclude intersegment revenue which eliminates on a consolidated basis. |
|
Reconciliation of Income Statement Line Items |
|||||||
|
(Unaudited; in millions, except %s) |
|||||||
|
Three Months Ended |
Six Months Ended |
||||||
|
June 30, |
June 30, |
||||||
|
2022 |
2021 |
2022 |
2021 |
||||
|
U.S. GAAP cost of sales |
$ 2,413.5 |
$ 3,250.1 |
$ 4,834.0 |
$ 6,553.1 |
|||
|
Deduct: |
|||||||
|
Purchase accounting related amortization |
(644.9) |
(1,169.8) |
(1,303.7) |
(2,424.8) |
|||
|
Acquisition related items |
(15.8) |
(1.0) |
(24.8) |
(3.5) |
|||
|
Restructuring related costs |
(6.7) |
(78.7) |
(19.8) |
(246.5) |
|||
|
Share-based compensation expense |
(0.5) |
(0.6) |
(0.8) |
(1.2) |
|||
|
Other special items |
(40.5) |
(99.4) |
(81.5) |
(186.1) |
|||
|
Adjusted cost of sales |
$ 1,705.1 |
$ 1,900.6 |
$ 3,403.4 |
$ 3,691.0 |
|||
|
Adjusted gross profit (a) |
$ 2,411.7 |
$ 2,677.2 |
$ 4,905.1 |
$ 5,317.1 |
|||
|
Adjusted gross margin (a) |
59 % |
58 % |
59 % |
59 % |
|||
|
Three Months Ended |
Six Months Ended |
||||||
|
June 30, |
June 30, |
||||||
|
2022 |
2021 |
2022 |
2021 |
||||
|
U.S. GAAP R&D |
$ 162.6 |
$ 147.7 |
$ 304.9 |
$ 331.8 |
|||
|
Add / (Deduct): |
|||||||
|
Acquisition related costs |
(1.7) |
(0.2) |
(3.7) |
(0.3) |
|||
|
Restructuring and related costs |
— |
(10.2) |
— |
(16.6) |
|||
|
Share-based compensation expense |
(1.6) |
(0.8) |
(3.0) |
(1.9) |
|||
|
Other special items (b) |
(0.6) |
6.3 |
(0.9) |
(8.4) |
|||
|
Adjusted R&D |
$ 158.7 |
$ 142.8 |
$ 297.3 |
$ 304.6 |
|||
|
Adjusted R&D as % of total revenues |
4 % |
3 % |
4 % |
3 % |
|||
|
Three Months Ended |
Six Months Ended |
||||||
|
June 30, |
June 30, |
||||||
|
2022 |
2021 |
2022 |
2021 |
||||
|
U.S. GAAP SG&A |
$ 981.1 |
$ 1,204.8 |
$ 1,896.4 |
$ 2,391.3 |
|||
|
Deduct: |
|||||||
|
Acquisition related costs |
(104.7) |
(47.2) |
(178.5) |
(104.4) |
|||
|
Restructuring and related costs |
(3.5) |
(165.8) |
(7.2) |
(307.0) |
|||
|
Purchase accounting amortization and other related items |
— |
— |
(0.1) |
— |
|||
|
Share-based compensation expense |
(27.5) |
(29.5) |
(54.0) |
(60.5) |
|||
|
Other special items and reclassifications |
(17.0) |
(10.2) |
(24.4) |
(29.5) |
|||
|
Adjusted SG&A |
$ 828.4 |
$ 952.1 |
$ 1,632.2 |
$ 1,889.9 |
|||
|
Adjusted SG&A as % of total revenues |
20 % |
21 % |
20 % |
21 % |
|||
|
Three Months Ended |
Six Months Ended |
||||||
|
June 30, |
June 30, |
||||||
|
2022 |
2021 |
2022 |
2021 |
||||
|
U.S. GAAP total operating expenses |
$ 1,154.6 |
$ 1,375.5 |
$ 2,218.4 |
$ 2,769.0 |
|||
|
Deduct: |
|||||||
|
Litigation settlements and other contingencies, net |
(10.9) |
(23.0) |
(17.1) |
(45.9) |
|||
|
R&D adjustments |
(3.9) |
(4.9) |
(7.6) |
(27.2) |
|||
|
SG&A adjustments |
(152.7) |
(252.7) |
(264.2) |
(501.4) |
|||
|
Adjusted total operating expenses |
$ 987.1 |
$ 1,094.9 |
$ 1,929.5 |
$ 2,194.5 |
|||
|
Adjusted earnings from operations (c) |
$ 1,424.6 |
$ 1,582.3 |
$ 2,975.6 |
$ 3,122.6 |
|||
|
Three Months Ended |
Six Months Ended |
||||||
|
June 30, |
June 30, |
||||||
|
2022 |
2021 |
2022 |
2021 |
||||
|
U.S. GAAP interest expense |
$ 145.9 |
$ 167.1 |
$ 292.1 |
$ 336.1 |
|||
|
Add / (Deduct): |
|||||||
|
Interest expense related to clean energy investments |
— |
(0.3) |
— |
(0.3) |
|||
|
Accretion of contingent consideration liability |
(1.8) |
— |
(3.8) |
— |
|||
|
Amortization of premiums and discounts on long-term debt |
16.1 |
16.5 |
32.9 |
32.5 |
|||
|
Other special items |
(1.1) |
(2.7) |
(2.2) |
(5.4) |
|||
|
Adjusted interest expense |
$ 159.1 |
$ 180.6 |
$ 319.0 |
$ 362.9 |
|||
|
Three Months Ended |
Six Months Ended |
||||||
|
June 30, |
June 30, |
||||||
|
2022 |
2021 |
2022 |
2021 |
||||
|
U.S. GAAP other expense, net |
$ 13.5 |
$ 4.2 |
$ 47.2 |
$ 10.3 |
|||
|
Add / (Deduct): |
|||||||
|
Clean energy investments pre-tax loss (d) |
(0.1) |
(16.7) |
— |
(34.6) |
|||
|
Other items |
0.4 |
— |
1.9 |
— |
|||
|
Adjusted other expense (income), net |
$ 13.8 |
$ (12.5) |
$ 49.1 |
$ (24.3) |
|||
|
Three Months Ended |
Six Months Ended |
||||||
|
June 30, |
June 30, |
||||||
|
2022 |
2021 |
2022 |
2021 |
||||
|
U.S. GAAP earnings (loss) before income taxes |
$ 389.3 |
$ (219.1) |
$ 916.8 |
$ (660.4) |
|||
|
Total pre-tax non-GAAP adjustments |
862.5 |
1,633.4 |
1,690.8 |
3,444.5 |
|||
|
Adjusted earnings before income taxes |
$ 1,251.8 |
$ 1,414.3 |
$ 2,607.6 |
$ 2,784.1 |
|||
|
U.S. GAAP income tax provision |
$ 75.4 |
$ 60.1 |
$ 203.7 |
$ 656.4 |
|||
|
Adjusted tax expense (benefit) |
111.1 |
173.7 |
213.3 |
(169.2) |
|||
|
Adjusted income tax provision |
$ 186.5 |
$ 233.8 |
$ 417.0 |
$ 487.2 |
|||
|
Adjusted effective tax rate |
14.9 % |
16.5 % |
16.0 % |
17.5 % |
|||
|
___________ |
|
|
(a) |
U.S. GAAP gross profit is calculated as total revenues less U.S. GAAP cost of sales. U.S. GAAP gross margin is calculated as U.S. GAAP gross profit divided by total revenues. Adjusted gross profit is calculated as total revenues less adjusted cost of sales. Adjusted gross margin is calculated as adjusted gross profit divided by total revenues. |
|
(b) |
Beginning in 2022, upfront and milestone-related R&D expenses related to collaboration and licensing arrangements are no longer excluded from adjusted net earnings and adjusted EBITDA. This change had no impact on the three and six months ended June 30, 2022. For all prior periods presented, these expenses and payments were excluded from adjusted net earnings and adjusted EBITDA. Prior period adjusted net earnings and adjusted EBITDA have not been recast to reflect this change in policy because the excluded amount was income of approximately $6.3 million and $5.8 million for the three and six months ended June 30, 2021, respectively, and is considered immaterial. |
|
(c) |
U.S. GAAP earnings from operations is calculated as U.S. GAAP gross profit less U.S. GAAP total operating expenses. Adjusted earnings from operations is calculated as adjusted gross profit less adjusted total operating expenses. |
|
(d) |
Adjustment represents exclusion of activity related to Viatris' clean energy investments, the activities of which qualify for income tax credits under section 45 of the U.S. Internal Revenue Code of 1986, as amended. |
|
Reconciliation of Estimated 2022 U.S. GAAP Net Cash Provided by Operating Activities to Free Cash Flow |
||
|
A reconciliation of the estimated 2022 U. S. GAAP Net Cash provided by Operating Activities to Free Cash Flow is presented below: |
||
|
Previous Guidance |
Current Guidance |
|
|
Estimated U. S. GAAP Net Cash provided by Operating Activities |
$3,200 - $3,400 |
$3,100 - $3,300 |
|
Less: Capital Expenditures |
$(525) - $(675) |
$(425) - $(575) |
|
Free Cash Flow |
$2,500 - $2,900 |
$2,500 - $2,900 |
![]()
SOURCE Viatris Inc.
